
What is GA4? How does it work? What is the primary difference between GA3 and GA4? Why should you switch to GA4 now? Read Here!

Why it is Important to Switch to GA 4 Now
Google Analytics is one of the most powerful tools for marketers and companies. It monitors and analyzes website traffic and gives marketers massive amounts of information about web traffic, online users, their preferences, and ways they get to your website.
You can use Google Analytics to expand and grow your company if you run a small business or giant corporation. However, the older version of Google Analytics has a few downsides. For instance, it has limited dashboard capabilities, preventing you from customizing specific reports.
In addition, it also has missing information because it blocks cookies and switches off JavaScript to track visitors’ behavior. So, this leads to under-reporting due to inefficient data tracking.
The good news is that Google has the newer version of Google Analytics 4, also known as GA4. Today’s article will discuss GA4 and highlight reasons to make an informed decision on whether you should switch to GA4. Read on!
What is GA4?
GA4 is an analytic service that enables digital marketers and companies to measure traffic and engagement across platforms, including websites and applications. It is the newest version of Google Analytics and allows marketers and companies to track websites and apps using the same account.
In addition, it comes with cutting-edge reporting features and provides digital marketers with in-depth information and insights. GA4 has an entirely different data architecture, storage, and processing mechanisms than the previous versions.
So, it provides new ways to track, measure, and analyze traffic for years. GA4 also looks different from Universal Analytics, with a changed navigation system and user interface.
Let us discuss why you should switch to GA4, but before that, knowing the difference between GA4 and Universal Analytics is essential. The purpose is to help you make an informed decision and let you understand whether GA4 is better than Universal Analytics.
GA4 Vs. Universal Analytics
Although GA4 is similar to Universal Analytics or GA3, it has massive differences. If you have used the previous version, you will notice various changes in how the newest version looks and how the navigation works.
In addition to the user interface and navigation, GA4 has other differences from the previous version. Google makes substantial efforts to add more reporting capabilities and functionalities to GA4.
For instance, GA4 misses the bounce rate because Google has replaced it with engaging sessions. So, you won’t see the percentage or number of people leaving your website. Instead, you will see data on users who visit your website and stay on it to explore your products and services.
Therefore, the ” Engagement Rate ” is the new metric Google wants marketers and businesses to focus on is the “Engagement Rate.” Moreover, GA4 does not use “goals.” Instead, it uses events, meaning you can track events and conversions.
The good news is that you can choose events that count as conversions. Google will also track events without modifying your website’s code. GA4 also misses historical data. What does this mean?
If you have used Universal Analytics and created a GA4 property, you can’t move the historical data to that property. So, you start from scratch. However, your historical data will remain safe in Universal Analytics.
However, you have to switch to Universal Analytics to analyze the historical data. Let us now discuss the prominent features and benefits of GA4 to help you decide whether to switch from Universal Analytics to GA4.
Reasons to switch to to Switch to GA 4:
1. Access to In-Depth Metrics
GA4 is one of the most powerful analytics tools, allowing marketers, data analysts, and companies to dive into user-centric and in-depth metrics. These metrics usually focus on the Lifecycle and the user.
Besides, GA4 uses user-centric metrics, data, and dimensions using artificial intelligence and machine learning algorithms to predict customer/buyer/users’ actions and implement more S.M.A.R.T tracking with predictive modeling or analytics.
Universal Analytics’ bounce rates have been replaced with more useful and valuable engagement metrics. For instance, when using GA4, an engaged session lasts ten seconds. It has at least one conversion event and involves two page views.
GA4 metrics allow digital marketers to leverage the power of events and measure engagements. It gives you a holistic view of website visitors, actions, and behaviors. The new feature, enhanced events, enables marketers to understand how their website visitors interact with the content. So, you can use “Enhanced Events” to:
- Scroll data
- Download files
- Search about your site
- Video and graphic engagement rates
So, this advanced level of event marketing is more sophisticated because it does not require custom code or a web developer’s assistance. Therefore, you can understand how visitors/users interact with your site, the type of content that compels users to click on CTAs, and what content requires optimization.
2. Track Customer/Buyer Journey
GA4 is an excellent tool to track customer or buyer journeys. The tool does not focus on measurements like fragmentation by device or platform, such as sessions. On the other hand, it focuses on users and their interactions via events.
These events happen across the website and application. For example, you can use GA4 Lifecycle to generate reports that align with different stages of the customer journey, including:
- Acquisition
- Engagement
- Interaction
- Monetization
- Retention
- Loyalty
So, you can use these reports to understand the buyer’s journey. At the same time, these reports enable you to identify gaps and complications and determine opportunities via insights. Thus, you can positively change your marketing strategy and make the most of it.
3. Quick Big Query Integration
Big Query is one of the most famous data warehouses. It helps you track, manage, and analyze data and has built-in features that can improve your overall business processes. These features are:
- Machine learning
- Geospatial analysis
- Business intelligence
So, you can use Big Query and SQL to answer complex questions without deploying the infrastructure management. GA4’s integration with this data warehouse allows you to analyze massive datasets quickly.
At the same time, it performs advanced analysis of large volumes of raw data from GA4 and helps you generate valuable insights via machine learning algorithms. Similarly, you can combine data with these insights from other marketing and customer relationship management (CRM) tools. The purpose is to create a repository that gives insights into the customer/buyer journey.
4. Create Targeted Segments
GA4 enables you to create targeted segments for your digital marketing campaigns. You can create segments based on various factors, such as events and time, allowing you to group users based on interactions, events, and time. Remember, this also focuses on events and arbitrary device categories.
When you leverage the power of these measurements and analytics, you can create precise and targeted audiences with a complete picture of who is using your web pages and how they engage with your content. The purpose is to create endless possibilities and lead to more optimized conversions and sales.
Moreover, one of the most significant benefits of GA4 is that it automatically shares audiences with Google Ads. Thus, you can focus on paid advertising campaigns for website visitors who follow a specific behavior pattern.
When you have more targeted audiences, you can optimize campaigns and reach your audiences at the right time. More sophisticated marketing campaign strategies and audiences can generate higher ROIs.
5. Automatic Alerts
GA4 uses machine learning algorithms and models designed and developed by experienced professionals working in Google. Thanks to machine learning algorithms, you can receive automatic alerts when trends appear in the data. For instance, if your business sells more of a specific product, GA4 will let you know before you see an increased number of sales.
So this enables you to respond fast and contact suppliers to keep the product in stock. GA4 also helps marketers and businesses to predict behavior among specific customer groups.
For instance, the tool creates models that can measure the potential revenue of a customer group. It also calculates churn probabilities of different customer/user/visitor segments.
6. Realistic Marketing Campaigns
GA4 is one of the best ways to create realistic marketing campaigns because it helps you unify your website and app data. GA4 also provides a future-proofed solution even if you don’t have an application. However, this is valuable if you have planned to develop an app in the future.
In addition to synchronizing your website with app data and analyzing customer journeys across platforms, GA4 enables you to analyze user behavior by their position in the purchasing funnel based on factors like awareness and conversion.
A better understanding of how customers/visitors/users behave at different stages allows you to create a more sophisticated marketing strategy. For instance, if you notice that your product sales are due to a coupon or discount strategy shared on Facebook or Instagram, you can invest more on these social networking platforms.
7. Future-Proof Design and Privacy
Future-proof design is one of the most significant advantages of GA4. It focuses on user privacy because it moves away from cookie-based tracking. Therefore, switching to and using GA4 is an excellent way for marketers and businesses to streamline their data operations.
GA4 provides you with sophisticated solutions without depending on cookies. Although Google recognizes that some data gaps may occur with this approach, the company makes substantial efforts and uses accurate modeling techniques to overcome these complications.
8. Leverage the Power of Explorations
“Explorations” is one of the most powerful features offered by the newest Google Analytics. It accommodates specific goals and lets marketers create reports via data visualization and analytical techniques.
Although Universal Analytics has a similar feature, it requires marketers and businesses to pay money using Google Analytics 360 users. However, this is a free feature with GA4.
In addition, “Explorations” allow you to track content, research audiences, and optimize conversion rates to the next level. You will find ready-made “Explorations” in the template gallery. These templates/explorations can help you analyze specific marketing areas, including:
- Funnel performance
- User segment overlaps
- Lead acquisition performance
- User cohorts behavior
- User lifetime value
Getting Started With GA4
Although switching to GA4 from the previous version of Google Analytics is daunting for many businesses and digital marketers, it is worth your time because it streamlines your online data and provides you with tools to create realistic, user-oriented, and time-bound marketing campaigns.
There are a few ways to get started with GA4. For instance, you can add GA4 to your website that you currently analyze with the older version. So, if you are familiar with the previous version, you can use this option to streamline the entire process.
Google’s setup assistance adds the GA4 property to the already existing one. Bear in mind that the older platform will collect data until July 2023. So, you can switch between the older and newer version based on your needs.
If you need help getting started, feel free to connect t@rimanagency.com
Final Words
Companies collect user/customer data from various channels, including websites, apps, eCommerce platforms, and social media. GA4 is a cutting-edge tool to create comprehensive customer profiles using the collected data, gain insights into users’ behaviors, and provide more personalized experiences to your customers using effective, reliable, and user-oriented marketing campaigns.
If you find it challenging to get started with GA4, you can hire Riman Agency to streamline the process. We have a team of qualified, experienced, and skilled data analysts and digital marketers with an in-depth understanding of GA4. Contact us today for more information or discuss your requirements with our professional team. Until Next Time!
An Introduction to Google Analytics
Analytics matters, what it can do for you, why it’s critical for business success, etc. Now it’s time to get critical.
What exactly is Google Analytics and how do you get all that amazing data out of it?
Let’s dive in.
To start, here are 3 acronyms to remember:
- GA = Google Analytics
- SEO = Search Engine Optimization
- SEM/Paid Search = Search Engine Marketing
Before I go any further, I’ll include a side note for anyone who’s reading this book to learn how to stalk or otherwise mine personal data: Google Analytics doesn’t track personal information. What it gathers is known as non-PII data, which stands for non personally identifiable information. So, when I say that GA can tell you where your visitors live, what that means is that it can give you the breakdown of geographical information. For example, it can tell you that in July, 17% of your website traffic originated from the New York City area. It cannot tell you the names, addresses or any other potentially identifiable information about your visitors.
So, what is Google Analytics?
It is a free website analytics service created by Google, following the acquisition of a company called Urchin in November 2005. It gives insight into how users find and use your website, as well as non-PII demographic information.
As of this writing, GA is the most used web analytics tool in the world. With GA, you can track ROI for your online marketing and gather intel to effectively boost the ROI of future campaigns. The building blocks of GA reports are dimensions and metrics. Dimensions are the attributes of your data and metrics are the quantitative measurements for those dimensions. The main reason that Google Analytics is so popular is because it is a state-of-the-art tool. It is also, as of this writing, absolutely free, and when it comes to functionality, it can track almost anything that is connected to the internet, from eCommerce platforms, to mobile apps, to POS systems and beyond. It is also incredibly user-friendly and compatible with multiple other Google tools.
What You Need to Know Before Using Google Analytics
Like nearly everything else in life, GA requires you to have a Google Gmail account (which is also free). So make sure that you have that before you start.
Once you’ve got your Gmail account and have created your GA account, note that GA will only be able to track pages that have the GA tracking code embedded in them. If you want to track your whole website, every single page will need to have the code embedded. This is very easy to do and there are many tutorials to be found online. If you have a website administrator, it’s something they should be able to do within minutes. It should also be set up so that anytime a new page is created (a new blog post or landing page, for example), the GA code is automatically embedded in that new page. This, too, is very simple to do, and we’ll get to the how-to shortly.
To learn more about Google Analytics and Web Analytics.
Get your copy of https://www.amazon.com/Secret-Capitalizing-Analytics-Approach-Beginners-ebook/dp/B07QKPY4K3
An Intro to Microsoft Clarity Web Analytics
What is Microsoft Clarity Web Analytics? How is Microsoft Clarity different from Google Analytics? Should you install it? And How to get started?
Microsoft is entering the web analytics world with style by introducing Clarity by late October 2020: https://clarity.microsoft.com/
After testing the tool out in the past few days, I wanted to share some of its best features, how to get started, and some questions that I got from students on the tool.
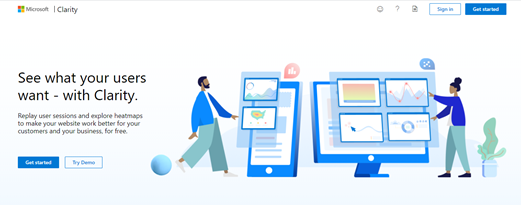
Source: https://clarity.microsoft.com/
Here are some questions that I addressed that I believe will help you get a better idea of the tool and how it can better serve you or your business.
So what is Microsoft Clarity?
In essence, it is a tool that allows you to clearly understand what users are doing on your site, using features such as Heatmaps, Session Playbacks and Insights.
Based on Microsoft’s site, it is a behavioural analytics tool, meaning it is concentrated on user interaction and behaviour.
Is Microsoft Clarity free?
Yes.
Can I try Microsoft Clarity out without installing it?
Yes, there is a demo that Microsoft provides: https://clarity.microsoft.com/demo/projects/view/3t0wlogvdz/dashboard
How is Microsoft Clarity different from Google Analytics?
While Analytics includes Acquisition, Audience, Conversion, and Behaviour reports; which respectively allows you to understand how people come to your site, who is visiting your site, are they converting on your site and how they are behaving when they are on your site; Microsoft Clarity concentrates mostly on behaviour. The tool extensively covers behaviour through features such as Heat Mapping and Session Recording that we don’t see on Google Analytics.
Should I Install Microsoft Clarity?
Let me rephrase this question. Should I install Microsoft Clarity even if I already have Google Analytics in place on the site?
Definitely. It is a great and different way to truly understand why people are :
- Engaging
- Not engaging
- Bouncing
- Converting
- Not converting
- What are they getting distracted by?
The tool is a great way to answer whether you should change a CPA or not. Whether you should add video, change a photo, update the navigation bar, etc.…
What makes Microsoft clarity different from Google Analytics?
- Session playbacks
- Heatmaps
- Insights
What are session recordings? And how can that benefit my website/business?
- It is a functionality that will allow you to track how individual users are behaving on your web property, by showing you individual session recordings.
- This can help you see what is going smoothly and what is disrupting their flow.
- This functionality is especially useful to fix detailed issues and investigate the exit rate or bounce rate. It is not ideal for major decision making.
Here is a short video:
Here is how Session recordings look:

Source: https://clarity.microsoft.com/
What are heatmaps? And how can that benefit my website/business?
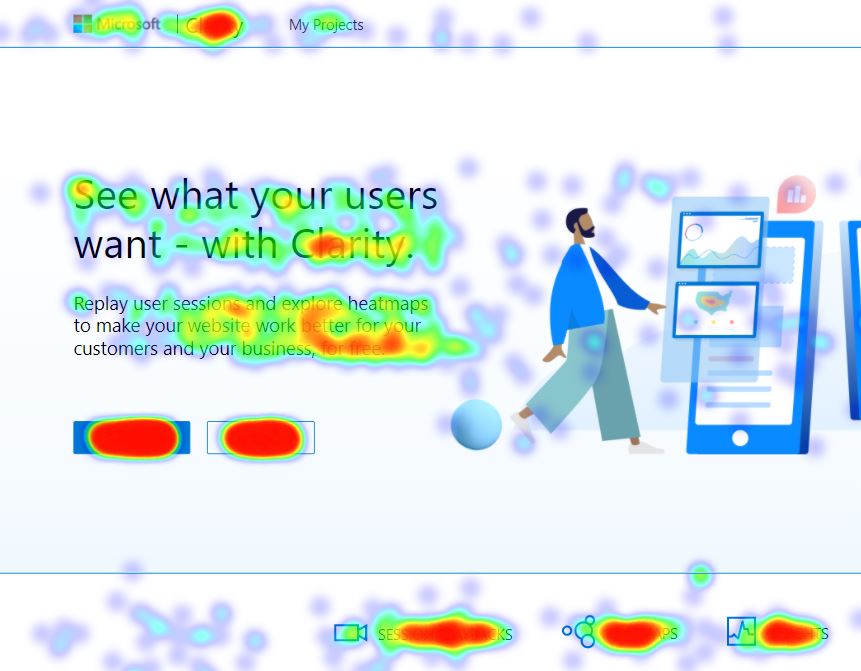
- It is a functionality that will allow you to see how a specific segment of users or a group of users has navigated through your page. What caught their attention and what didn’t.
- This is ideal for decision making.
- It is a great way to see what drove engagement on the page.
- If you are to start, start with heatmaps and then hone in through session recordings, which might give you a more detailed answer.
Here is how heatmaps look like:
https://clarity.microsoft.com/demo/projects/view/3t0wlogvdz/heatmaps?date_h=Last%203%20days&url_h=https%3A%2F%2Fclarity.microsoft.com%2F
What are Insights?
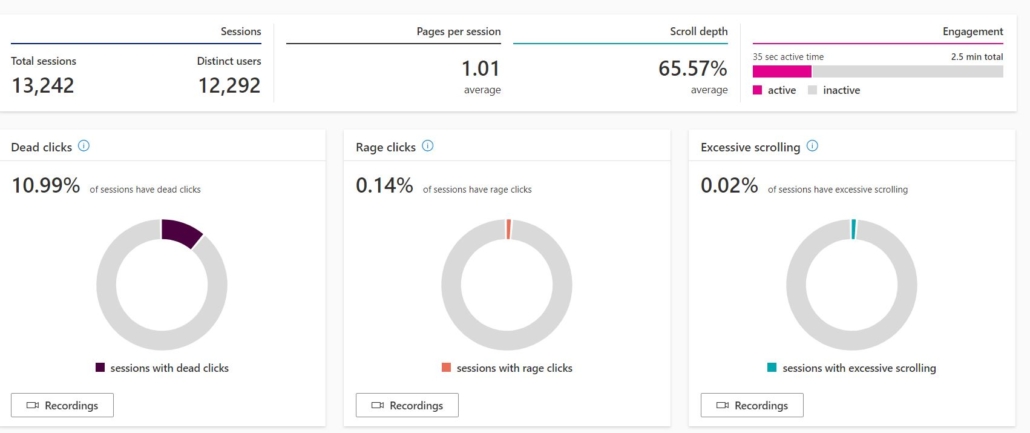
- Insights are great for decision making and finding general site issues.
- It is the set of meaningful numbers and graphs created by Microsoft Clarity by refining the data created by visitors on your web property.
Here is how Insights look like:
Source: https://clarity.microsoft.com/
How to get started with Microsoft Clarity?
Step 1: Go to https://clarity.microsoft.com/
Step 2: Click gets started:
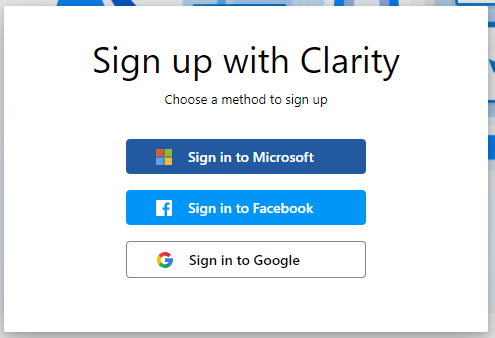
Step 3: You will be asked to sign in using either Microsoft, Facebook or Google.
Choose whichever suits you:
Step 4: Create a new project.
(Project here resembles what we call account in Google Analytics)
Fill in your site details, with the proper URL and Category.
See the example below:
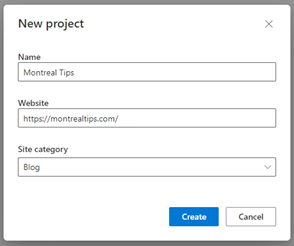
A new project will popup on the left-hand corner of your screen.
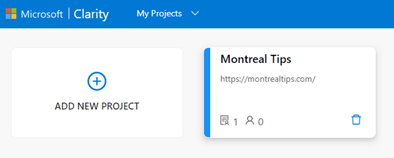
As you click on that project you will be prompted with few integration options.
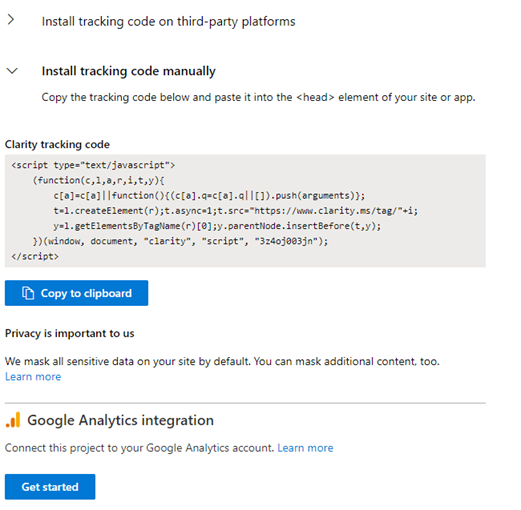
You can choose:
- Install tracking code on third-party platforms. Such as Google Analytics.
- Install it manually by copy-pasting the code into your site’s <Head> element.
There is also the option of integrating your Microsoft clarity account with Google Analytics.
For this example, I will go with the manual option.
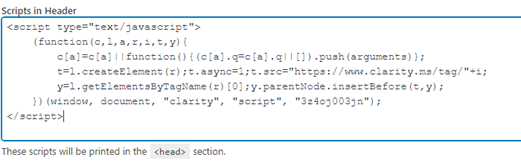
And you are set. Remember that it takes around 2 hours to start seeing the data.
Feel free to reach out if you have questions: t@rimanagency.com
The NextGEN of Google Analytics is Here
Google has just launched their new and improved Google Analytics 4.0, extending beyond Universal Analytics. The New GA relies on AI and machine learning to create predictions for traffic, conversion, products, etc. What does this mean for businesses? Read on for 10 key things to know, as well as a deeper dive into this exciting update to Google Analytics.
10 Key Things to Know About GA 4.0:
- It no longer requires coding or GTM for event tracking.
- You can access 4.0 from your current Analytics account by going into Admin 🡪 Property (Create new property) 🡪 Select (Web and app) 🡪 where you can track your website, mobile app or both.
- It is moving away from cookies and will no longer use third-party cookies to track performance.
- GA 4.0 is where AI meets data for marketers.
- You will have access to predictive metrics and customer lifecycle metrics.
- It provides more granular data control.
- It allows improved cross-device measurement & tracking.
- It allows deeper integration with search efforts on Google Ads.
- Google will be investing more in Analytics 4.0, and will stop updating the older version.
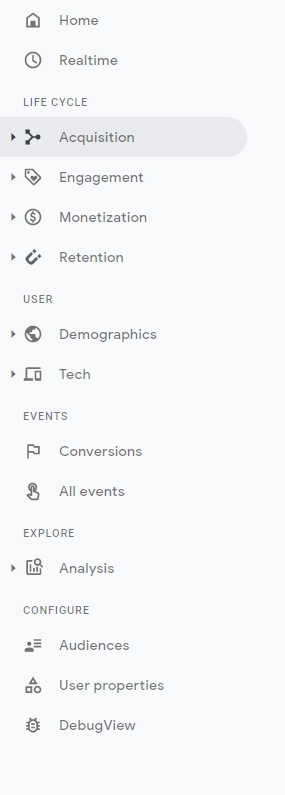
- While GA in the past was divided into Acquisition, Behavior, Audience, and Conversion reports, the new platform is divided into Life Cycle, User, Events, Explore, and Configure.
What This Means for SEM & Google Ads
As we know, Google Analytics is the backbone of a strong SEM strategy, enabling us to make data-driven decisions and immediately adapt to market changes, test results, trends, etc.
With GA 4.0, we now have better audience integration, empowering better exclusion and audience selection based on actions taken across devices and platforms. This means you will be able to see, for example, if someone came from the web, but ended up converting from desktop, which could open up whole new channels for understanding the customer journey.
From a user behaviour standpoint, Google has introduced more user-centric metrics such as LTV (Life Time Value) and expected average churn rate, empowering more informed long term strategies.
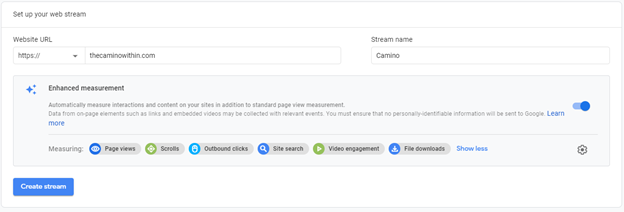
GA 4.0 will also allow you to set up enhanced measurements to automatically measure interactions and content on your site, in addition to standard page view measurement.
In this example, you can see on the dashboard right after being set up where GA captures the Page View + Video Progress + Video Start as part of the enhanced measurement features. See below:
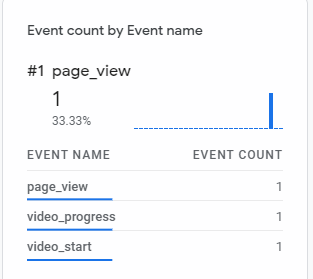
This means, you will no longer need to code or use GTM to track specific actions on-page, making it easier and possibly faster for marketers. This is especially beneficial for marketers who do not have the know-how or access to make code changes, or in organizations where code changes need to go through approvals or a potentially lengthy ticketing process.
Why You Should Set Up 4.0 (aside from the benefits)
In their update, Google noted that they will be investing in the new platform moving forward and, therefore, moving away from the old one. Your current GA account will still be fully functional, but this likely means that things like support, bug fixes and updates will be phased out, so it’s a good idea to upgrade now.
Learn more: https://support.google.com/analytics/answer/10089681#start
How To Get Setup
The first step is to know what account type you currently have. If you were part of the GA 4.0 beta program, your account would have been known as “App + Web properties”. If you were not part of the beta, your account type would now be known as “Universal Analytics”.
If you have a Universal Analytics account, you can easily create your new GA 4.0 property from your existing one, meaning you won’t lose your current data. The link above will give you the information you need to do this.
Note: If you did not previously have a GA account, GA 4.0 is now the default, so you would automatically get it upon setting up your account.
Tagging
When it comes to tagging, you can continue to use existing on-page tags or add new on-page tags. Currently, there are no benefits or downsides to either choice, this is a matter of preference.
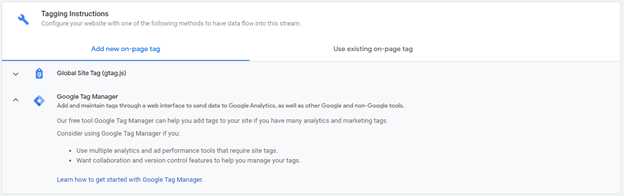
Here is a sneak peek into the new GA experience look and feel:
Real-Time Reports
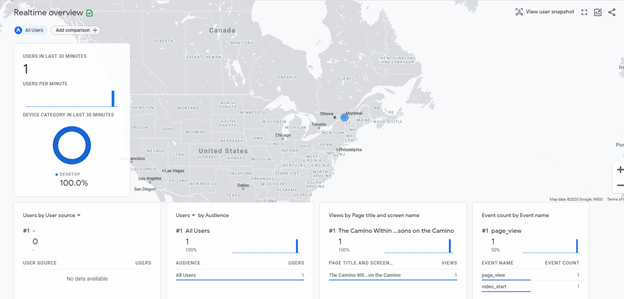
New Categorization
As mentioned earlier, the previous categorization of Acquisition, Behavior, Audience, and Conversion reports has been updated to Life Cycle, User, Events, Explore, and Configure. Here’s what that looks like:
The Bottom Line
Love it or hate it, Google Analytics 4.0 is here to stay, and there’s no question that the platform is getting more powerful with each iteration. What are your thoughts on the new GA?
Sources:
https://blog.google/products/marketingplatform/analytics/new_google_analytics
https://support.google.com/analytics/answer/9445345?hl=en
Google Analytics Most Important Metrics
Google Analytics (GA) is one of the most powerful tools a business can adopt, and one of the few exceptions to the “you get what you pay for” rule. It’s incredible how much valuable data you can get from a free tool. Valuable and actionable data.
However, the sheer volume of data and metrics available can feel daunting to people who aren’t familiar with analytics. What’s most important? What should you focus on? What should you tackle first? Every business is different, with different goals and markets, so what you focus on will depend on that. But, there are several metrics that can provide great value to virtually every business.
Whether your aim is to improve your search engine rankings, keep people on your site longer, increase onsite conversions, raise brand awareness, etc., these five Google Analytics metrics should be featured on every business’s GA dashboard:

Photo by Austin Distel on Unsplash
Here is the list of the most important Google Analytics Metrics:
Bounce Rate
This is the percentage of visitors who arrive on your site, then leave (i.e. close their browser window or tab, or navigate to another website) without accessing any other pages within your site.
Through GA, you can check the bounce rate of your site overall, as well as the bounce rate of individual pages. Checking the stats of individual pages gives you a good picture of your most engaging content and the content that most often leads to people dropping off. For pages where people stay and decide to explore more, you’ll want to boost visibility of those pages, use them as landing pages and try to create similar (but not duplicate) content on other pages.
For pages where people are dropping off, you’ll want to investigate how to improve those pages to reduce bounce rate, and potentially reduce their visibility by no longer using them as key landing pages while you’re working on improvements.
Time on Site
There are two reasons to watch this metric closely. First, search engines are giving more and more weight to ‘time on site’ as an indicator of the value and/or credibility of a page or overall website. It’s a good measurement because people spend more time with content that’s engaging, educational, useful or entertaining. Search engines like Google want to provide users with good content, so it makes sense that they’d rely on behavioural metrics like this one.
The second reason is that it’s an indicator to you of how engaging and useful people find your content. If people are just clicking through pages then dropping off, your content isn’t doing its job. But if they’re spending time with it, it means you’re doing something right.
Again, you’ll want to look at the overall time on site, but mainly focus on individual pages to see which ones are really striking a chord with your audience and which ones could do with some strategic optimization.
Pages Per Visit
Pages per visit is another indicator of engagement, but can also tell you if your site is easy to navigate, which matters to both your visitors and search engine spiders.
If you have a consistently low pages-per-visit rate, one of the first things you want to investigate is your site’s navigation. Are the links or menu items easy to find? Are the links actually working? Are they rendering properly across all browsers and devices, including mobile? Investigate all of this and consider getting someone unfamiliar with your site to give it a try and provide feedback.
If your navigation is visible and accessible, but you’re still seeing a low pages-per-visit rate, then it’s time to look at your content. Look at what they’re seeing first, where they go from there and where they’re dropping off to determine what might need to be optimized.
Conversion Rate
What does “conversion” mean? It will differ from business to business, project to project. It could be a sale, sign up, registration, download… whatever you want people to do on your site, that’s your conversion. Many businesses have several variations of conversions, including macro and micro conversions. For example, a sale or registration could be a macro conversion, whereas a newsletter signup or ebook download might be considered a micro-conversion.
Conversions matter because they’re kind of the whole point of your website. They’re what keep you in business! This is another instance where you will want to drill it down to individual pages to determine the type of content that is most likely to convert, and for which of your conversion types, and what content does not convert well.
Visits and Returning Visits

Photo by Austin Distel on Unsplash
In GA, new visits are people who have never visited your site before, whereas a return visitor is just that – someone who has been to your site before and is now coming back. Google Analytics does set a two year expiry, so if someone visited your site more than two years ago and is now returning, they will be counted as a new visitor.
You want to watch these metrics because a steady stream of new visitors means any marketing investments or search engine optimizations you’ve been making are paying off (in this case, you’ll want to look at where those visits are coming from to determine which of your investments are working and which are not). If you aren’t seeing noticeable spikes in new visits to coincide with campaigns, that’s an indicator that something has gone wrong. Either the content isn’t engaging enough, or there could be a technical issue like a broken link. This needs to be investigated ASAP.
Returning visits are yet another indicator of how engaging your content is to your audience. If people aren’t coming back, it could indicate an issue with your content, service or products. In this case, you’ll also want to look at where visitors are coming from. For example, are you investing in advertising that brings a lot of initial visits, but not quality visitors that come back again and again? What areas are driving traffic that converts to returning visitors? Invest in more of that and reconsider investments that aren’t driving quality traffic your way.
Takeaway
Never before in history have marketers, business owners and entrepreneurs had such a wealth of data available right at their fingertips. That brings a lot of advantages, but also this whole new problem of too much data to know what to do with it all! Instead of trying to analyze and act on all of it at once, aim to focus on a few key areas to start. Analyze reports, tweak your content and strategies, test, measure, analyze and update over and over again to continually improve your efforts, keep things fresh, respond to the market and grow your business.
Learn how to setup Google Analytics here.
Get your copy of: “The Secret to Capitalizing on Analytics”
Google Analytics Permissions Guide
Google Analytics structure is important when it comes to giving permissions and delegating rights to teams and individuals. For example, you may want to permit some people to view reports, but not make changes within the Google Analytics platform, whereas you may want to grant someone else permission to edit dashboards and create filters. The structure is a key part of that.
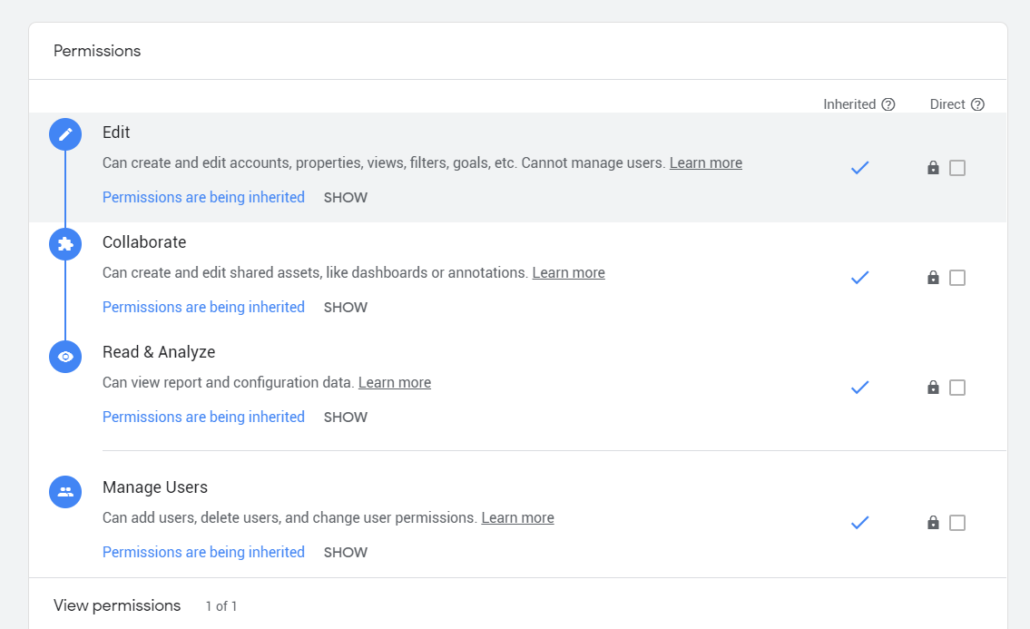
You can delegate four types of permissions in GA. Permissions can be granted at any level of the GA structure (Account, Property and View). Permission types include:
Manage Users (Permission): This allows someone to remove and add user access to the account.
This is a dangerous right to hand off, especially given the fact that if you grant this level of permission, you might be kicked off the account yourself. Ideally, only one person should be able to add and remove users. This way, you have better control over who has access, and what level of access they have, to your incredibly valuable data.
Edit (Permission): This allows someone to edit accounts, properties and views, filter data, and create goals. The only thing they can’t do is manage users. This permission level is ideal for Analytics experts.
Collaborate (Permission): This allows someone to edit shared dashboards or add annotations. This permission level is ideal for marketers, social media managers, and campaign managers.
Read & Analyze (Permission): This is a read-only level. It allows someone to read and view reports, but they cannot make any changes. This permission level is ideal for CEOs, managers, etc.
Note:
It is important to note that while you can grant permission at either the account, property or view level, that permission is hierarchical. That means, if you grant someone permission at the property level, they will automatically have access at the view level as well. Grant it at the account level, and they automatically have it at the property and view levels.
Learn More about analytics and how to capitalize on it: Get your copy of “The Secret to Capitalizing on Analytics” here
How to set up a Google Analytics Account Structure?
While setting up your account it is hard to foresee where the account will be in the future. Yet there are some factors that you should always account to, to ensure that your account is setup to grow in a sustainable manner.
Here are 6 factors to keep in mind when setting up your Google Analytics Account:
- Keep in mind that GA is there to serve your marketing and business strategy.
As much as the setup is important, it is more important to check it daily. Most successful marketers and business people check their analytics almost daily. It usually guides their decisions to be more data-driven. As you design your structure, think about how you will use it daily. - Don’t forget the purpose of data and GA. The main reason to use GA is to make sure visitors are doing what you want them to do on your site or web property. This could be contact form submission, sign up to a newsletter, buy a product, request a quote, etc. When setting up GA remember your KPIs and goals for the site.
- Remember that a big strength of GA is the ability to integrate with all the other Google tools. Keep in mind that you will likely be connecting your GA account with Google Ads, Google Search Console, Google Tag Manager, Google AdSense, etc.
- Another strength of GA is the ability to customize reports to your needs. As you go through the process of setting up GA, keep in mind how you want to view the data. Better yet, always bear in mind who will benefit from what report. When we approach the end of this book where you’ll learn how to customize data, bring these thoughts to life through the right dashboards.
- Through GA, you can compare data across different months, traffic sources and other dimensions. As you analyze different reports, remember to make data more relevant through comparing.
- Remember that GA can do (much of) the work for you. You are better off creating intelligent alerts to notify you of a rise or drop in traffic or any other significant change with your site data, rather than relying on manual daily checks.
Learn More about analytics and how to capitalize on it: Get your copy of “The Secret to Capitalizing on Analytics” here