agency-all-logos-(1)-2")
An Intro to Microsoft Clarity Web Analytics
What is Microsoft Clarity Web Analytics? How is Microsoft Clarity different from Google Analytics? Should you install it? And How to get started?
Microsoft is entering the web analytics world with style by introducing Clarity by late October 2020: https://clarity.microsoft.com/
After testing the tool out in the past few days, I wanted to share some of its best features, how to get started, and some questions that I got from students on the tool.
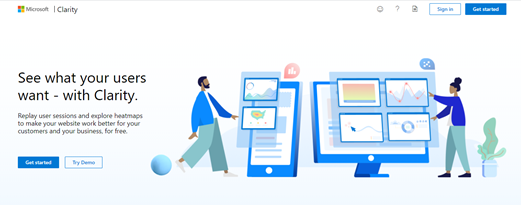
Source: https://clarity.microsoft.com/
Here are some questions that I addressed that I believe will help you get a better idea of the tool and how it can better serve you or your business.
So what is Microsoft Clarity?
In essence, it is a tool that allows you to clearly understand what users are doing on your site, using features such as Heatmaps, Session Playbacks and Insights.
Based on Microsoft’s site, it is a behavioural analytics tool, meaning it is concentrated on user interaction and behaviour.
Is Microsoft Clarity free?
Yes.
Can I try Microsoft Clarity out without installing it?
Yes, there is a demo that Microsoft provides: https://clarity.microsoft.com/demo/projects/view/3t0wlogvdz/dashboard
How is Microsoft Clarity different from Google Analytics?
While Analytics includes Acquisition, Audience, Conversion, and Behaviour reports; which respectively allows you to understand how people come to your site, who is visiting your site, are they converting on your site and how they are behaving when they are on your site; Microsoft Clarity concentrates mostly on behaviour. The tool extensively covers behaviour through features such as Heat Mapping and Session Recording that we don’t see on Google Analytics.
Should I Install Microsoft Clarity?
Let me rephrase this question. Should I install Microsoft Clarity even if I already have Google Analytics in place on the site?
Definitely. It is a great and different way to truly understand why people are :
- Engaging
- Not engaging
- Bouncing
- Converting
- Not converting
- What are they getting distracted by?
The tool is a great way to answer whether you should change a CPA or not. Whether you should add video, change a photo, update the navigation bar, etc.…
What makes Microsoft clarity different from Google Analytics?
- Session playbacks
- Heatmaps
- Insights
What are session recordings? And how can that benefit my website/business?
- It is a functionality that will allow you to track how individual users are behaving on your web property, by showing you individual session recordings.
- This can help you see what is going smoothly and what is disrupting their flow.
- This functionality is especially useful to fix detailed issues and investigate the exit rate or bounce rate. It is not ideal for major decision making.
Here is a short video:
Here is how Session recordings look:
Source: https://clarity.microsoft.com/
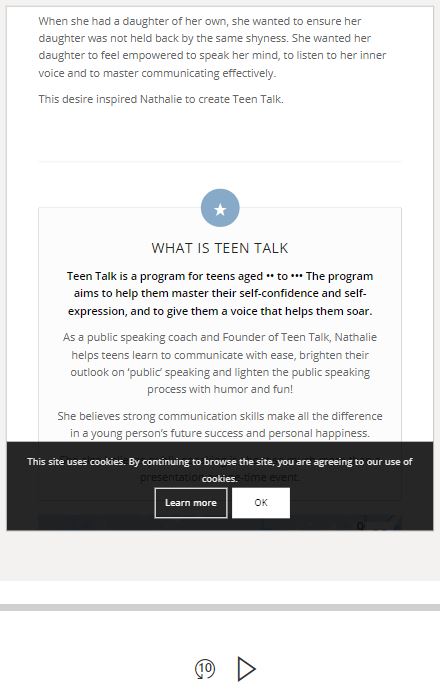
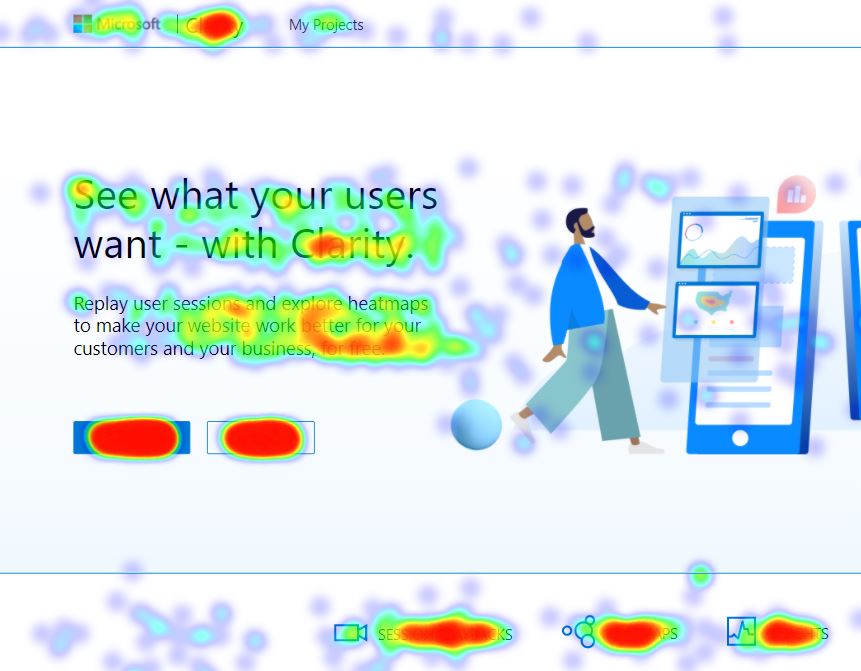
What are heatmaps? And how can that benefit my website/business?
- It is a functionality that will allow you to see how a specific segment of users or a group of users has navigated through your page. What caught their attention and what didn’t.
- This is ideal for decision making.
- It is a great way to see what drove engagement on the page.
- If you are to start, start with heatmaps and then hone in through session recordings, which might give you a more detailed answer.
Here is how heatmaps look like:
https://clarity.microsoft.com/demo/projects/view/3t0wlogvdz/heatmaps?date_h=Last%203%20days&url_h=https%3A%2F%2Fclarity.microsoft.com%2F
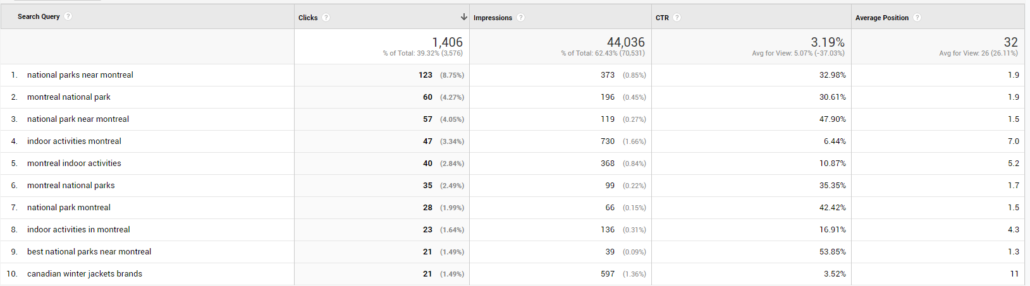
What are Insights?
- Insights are great for decision making and finding general site issues.
- It is the set of meaningful numbers and graphs created by Microsoft Clarity by refining the data created by visitors on your web property.
Here is how Insights look like:
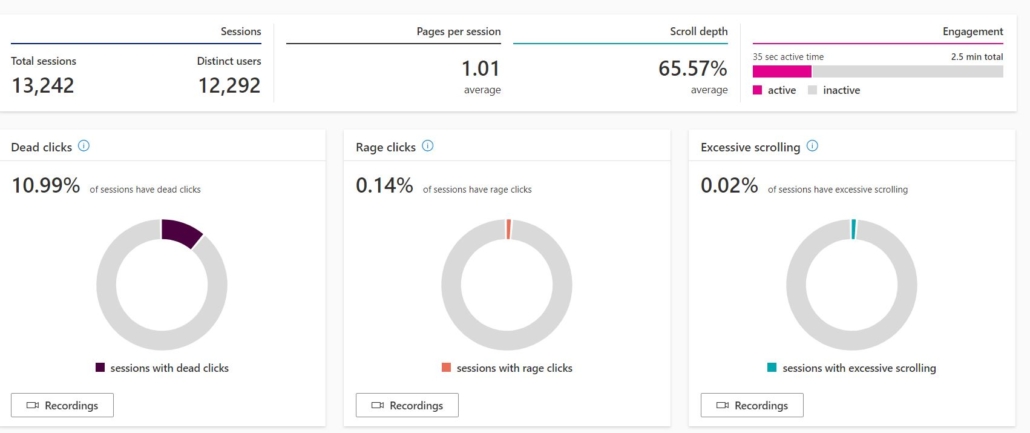
Source: https://clarity.microsoft.com/
How to get started with Microsoft Clarity?
Step 1: Go to https://clarity.microsoft.com/
Step 2: Click gets started:
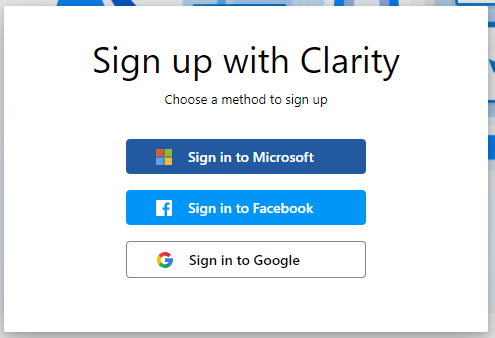
Step 3: You will be asked to sign in using either Microsoft, Facebook or Google.
Choose whichever suits you:
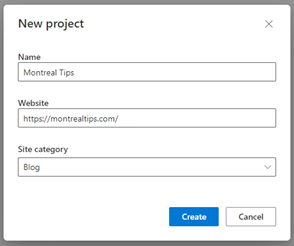
Step 4: Create a new project.
(Project here resembles what we call account in Google Analytics)
Fill in your site details, with the proper URL and Category.
See the example below:
A new project will popup on the left-hand corner of your screen.
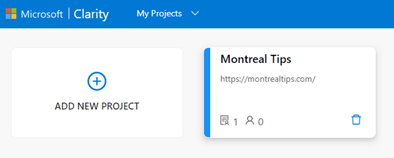
As you click on that project you will be prompted with few integration options.
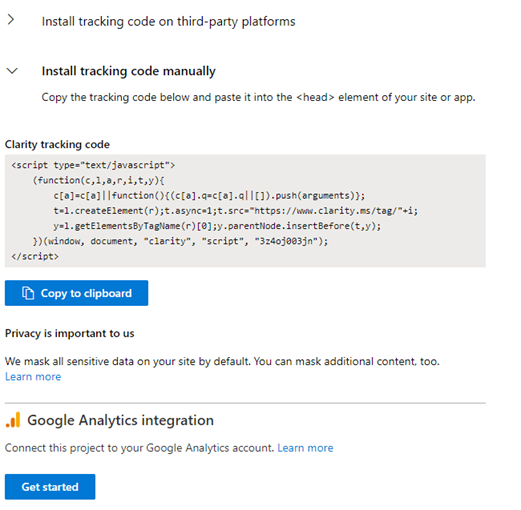
You can choose:
- Install tracking code on third-party platforms. Such as Google Analytics.
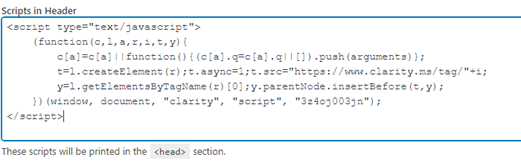
- Install it manually by copy-pasting the code into your site’s <Head> element.
There is also the option of integrating your Microsoft clarity account with Google Analytics.
For this example, I will go with the manual option.
And you are set. Remember that it takes around 2 hours to start seeing the data.
Feel free to reach out if you have questions: t@rimanagency.com