agency-all-logos-(1)-2")

How to use segments to get better analytics
Segments are one of the most underutilized tools in Google Analytics, and it is for that reason that in most of the classes I teach, I concentrate on segments as one of the cornerstones of measuring persona behaviours consistently.
Segments are not only great tools to measure performance in Google Analytics, in fact, they can be exported into other tools to help simplify customization.
For example, Google Data Studio.
Segments are subsets of Analytics data. Meaning your analytics data represents 100% of your visitors to the site, a subcategory could be males from age 35-45 which represents 17% of your visitors and that in turn is a subset of your total visitors.
In analytics, you have a wide variety of ways in which you can set up your segment.
As a business, you need to create segments as they will let you dive in and analyze personas, behaviours and campaigns which will help you optimize specific aspects of your business accordingly.
When you set up a segment you can apply it across any report in google analytics and it will remain there until you remove it.
Also, you can activate 4 segments at the same time which will enable you to compare them side by side.
Let’s take the following business scenario: we are a retailer and we want to see how our 43 target markets have performed in the previous month.
- Persona 1: Daniel
- Lives in USA, 35-45, Interested in sports & travel, Male
- Persona 2: Melissa
- Lives in Canada, 25-44, Interested in shopping, Female
- Persona 3: Mike
- Lives in the UK, 25-35, interested in technology, Male
So how do we create a segment?
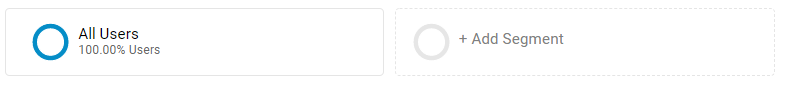
If we are to create a segment we can do so from any report, as long as you are inside Google Analytics, you are able to navigate to the top part of the page and click on the “+ Add Segment” sign next to the “All User” Tab, see below:
As you click on the “Add segment” you will be prompted to fill in details about your segment/persona.
You can easily get lost with the wide choices that you have, but you have to remember that if a segment is not scalable enough, then it is not worth measuring, so avoid checking or filling in a lot of the options. Make sure that you stick to your persona that you are aiming to research. For example for the persona below you can see how we choose the age group, gender, interest and location. 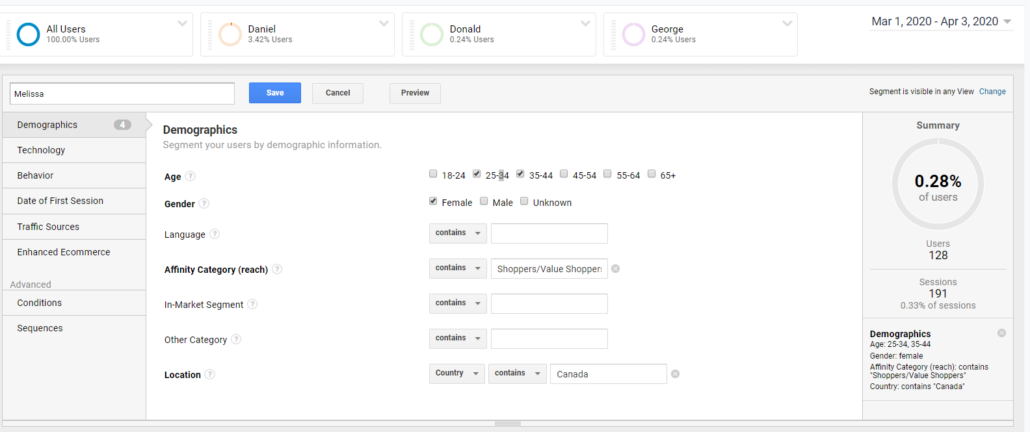
When it comes to segments here are the list of options that you have:
- Demographics where you Segment your users by demographic information. Includes:
- Age
- Gender
- Language
- Affinity category
- In-market segments
- Other categories
- Location
- Technology where you Segment your users’ sessions by their web and mobile technologies. Includes:
- Operating System
- Operating System Version
- Browser
- Browser Version
- Screen Resolution
- Device Category
- Mobile (Including Tablet)
- Mobile Device Branding
- Mobile Device Model
- Behaviour where you Segment your users by how often they visit and conduct transactions. Includes:
- Sessions
- Day since last session
- Transactions
- Session Duration
- Date of First Session where you Segment your users (create cohorts) by when they first visited. Includes:
- First session date range
- Traffic Sources where you Segment your users by how they found you. Includes:
- Campaign
- Medium
- Source
- Keyword
- Enhanced Ecommerce where you can Segment your users by their shopping behaviour. Includes:
- Revenue
- Product
- Product category
- Product brand
- Product variant
- Conditions where you can segment your users and/or their sessions according to single or multi-session conditions. Includes:
- Wide variety of options between dimensions and metrics which you can use in segmentation.
- Sequences that Segment your users and/or their sessions according to sequential conditions.
I know all this might seem overwhelming yet most of the options above are rarely used, yet it is good to know them.
Most of the time filtering happens on the demographic level.
The moment you create the segments you will be able to see them on the very top of the page with a percentage sign next to each one of the segments reflecting the percentage of the total visitors that are represented in this segment. See below:

You will realize that all your metrics are now divided into 4 and colour-coded.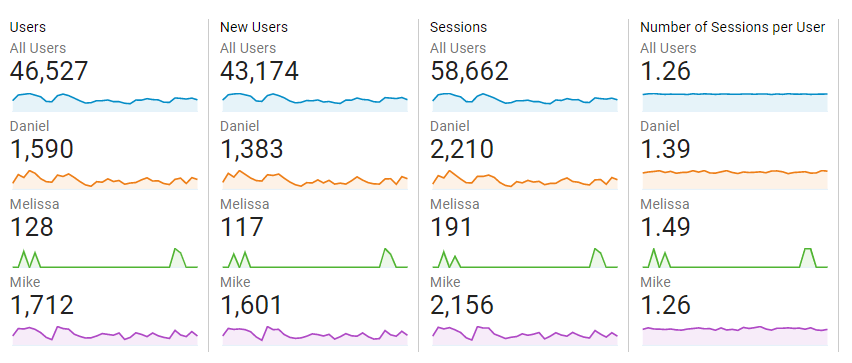
This will help you see how each of your segments is performing compared to each other and compared to the total amount of users on the site.
I always tend to keep all users there as it is a good benchmark to see if your segment is performing above or below average.
So let’s say I want to see which persona has the highest conversion rate:
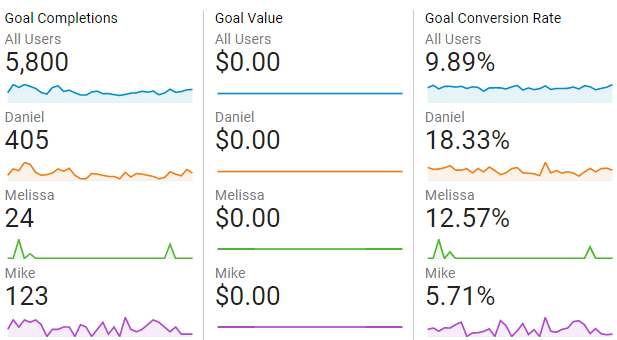
Looking at this graph you can see that Daniel, from the USA, is more likely to convert than the average visitor coming to the site.